The Attribution Models Are Getting Smarter. Most Brands Are Still Too Broke to Use Them.
By L&Y Decision
Every few months, a new paper lands claiming to have solved marketing attribution. This time it's causal structure learning bolted onto neural marketing mix models. The methodology is real progress. It also isn't the problem most brands actually have.
Forecasting Is Not Attribution
A recent arXiv paper titled "Forecasting Is Not Attribution" proved something practitioners have suspected for years: a model can predict your revenue with impressive accuracy and still tell you exactly the wrong story about which channel produced it. The decoder learns to bypass the causal path entirely, because bypassing it makes the forecast tighter.
That's not a minor bug. It's the whole argument for causal inference in one sentence. Correlation-optimized systems, including most of what Meta and Google hand you inside their own ad dashboards, get rewarded for prediction accuracy, not truth about cause and effect. A newer framework called DeepCausalMMM forces a directed acyclic graph onto the model, so it has to explain how channels interact before it earns credit for how much revenue they drove. A companion line of Bayesian causal MMM research goes further, attaching confidence intervals to every attribution weight instead of a single deceptively clean number.
Here's the part the papers don't say out loud: none of this works if your data is a mess. Causal structure learning needs six-plus months of clean, granular spend and outcome data across every active channel. Most brands don't have that. They have a Meta pixel that stopped firing correctly eighteen months ago, three UTM naming conventions used interchangeably, and a Shopify export that doesn't match what the ad platform reports. You cannot model your way out of broken plumbing. Tagging hygiene and cross-device stitching will move your attribution accuracy further than any model architecture, and almost nobody wants to fund that work because it doesn't produce a paper or a keynote.
The Compounding-Lift Story Is Survivorship Bias With a Confidence Interval
The same pattern shows up in conversion rate optimization. A 2026 study spanning 4,200 tests found the median experiment needs roughly 14,800 sessions per variation to reliably detect a 5% lift at 95% confidence. Server-side tests beat client-side tests by 4.7 percentage points in win rate, because the flicker and injection delay baked into client-side testing corrupts the very effect you're trying to measure.
Top-quartile testing programs run 24 or more experiments a year. The median brand runs 14. Compound a modest 6% median lift across eight to ten winning tests on a checkout funnel, and you can produce a 47 to 61% total lift over a year. That number gets repeated at every growth conference as proof that testing volume is the answer.
It's survivorship bias with a statistic attached. It counts winners and says nothing about the losers, the null results, or the traffic you needed to reach power in the first place. A brand doing $3M in annual revenue with 40,000 monthly sessions cannot run a properly powered test on most of its funnel within a calendar year. Telling that brand to test more isn't strategy. It's a recipe for false positives dressed up as rigor, because underpowered tests called early produce exactly the noisy, unreliable wins that erode trust in testing altogether.
The honest version: Test only where your traffic actually clears the power threshold, and put everything else into structured qualitative research, session recordings, and heuristic fixes that don't need a p-value to justify shipping.
The 3:1 Rule Was Never Built for Ecommerce
Then there's the number every founder has memorized without ever checking its origin: LTV:CAC should be 3:1. It's printed on pitch decks, quoted by investors, and treated as gospel. It's also a SaaS import that was never built for ecommerce. SaaS runs 70 to 85% gross margins, negative churn, and recurring revenue that compounds LTV in a way a single-purchase DTC transaction never will. DTC gross margins sit at 40 to 60%. A healthy DTC ratio is closer to 1.5:1 to 3:1, and even that range hides massive variance by category.
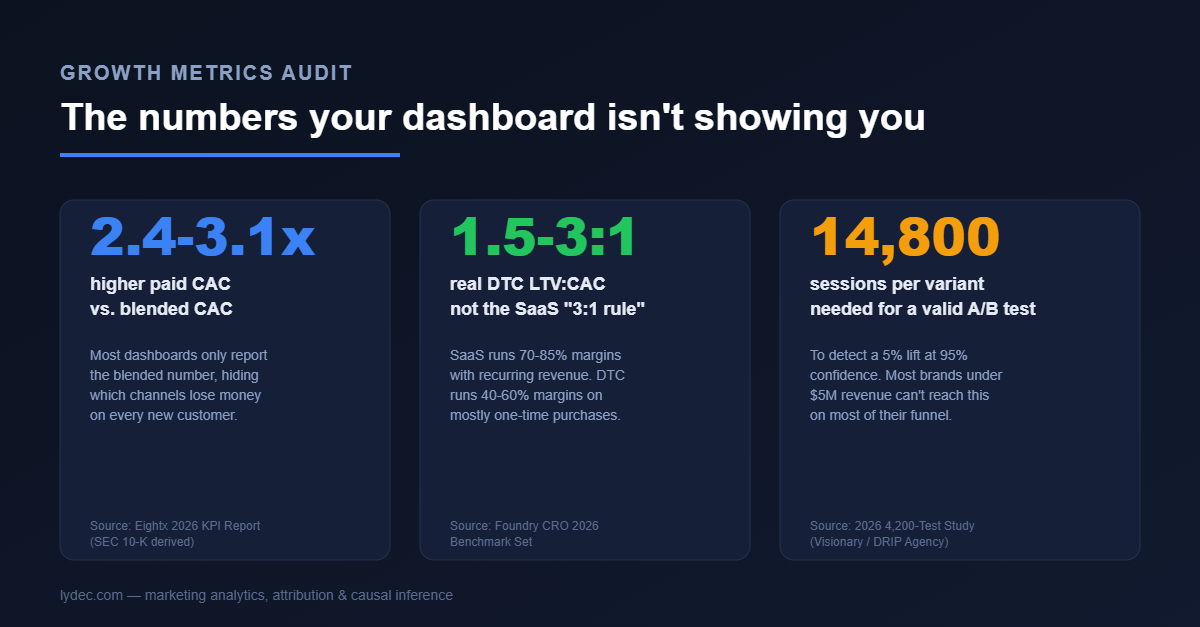
The more consequential blind spot sits one level deeper. New benchmark data pulled from SEC 10-K filings shows CAC has roughly tripled since 2015, and that paid CAC now runs 2.4x to 3.1x higher than blended CAC. Most internal dashboards report blended CAC because it's flattering and easy to calculate. But blended CAC hides the exact decision a CMO needs to make: which channels are losing money on every single new customer, right now. A board that only sees the blended number will approve budget increases into channels that are quietly bleeding cash, because the average looks fine even when half the portfolio isn't.
Earn the Right to the Sophisticated Model
None of this argues against sophistication. Causal MMM, properly powered testing, and disaggregated CAC reporting are the real, defensible edge in a market where privacy changes have broken platform-native attribution for good. What it argues against is buying the methodology before you've earned the right to use it.
If your tracking is broken, fix the tracking before you fund a causal model. If your traffic can't reach statistical power, stop pretending your A/B test results mean anything and go do the qualitative work instead. If your board has only ever seen blended CAC, that conversation is overdue, and it's cheaper than any dashboard you'll ever build.
The growth leaders who win the next two years won't be the ones with the fanciest model. They'll be the ones honest enough to know which rung of the measurement ladder they're actually standing on, and disciplined enough to fix the rung below before reaching for the one above it.
Source
Research referenced: "DeepCausalMMM: A Deep Learning Framework for Marketing Mix Modeling with Causal Structure Learning" (arXiv 2510.13087); "Forecasting Is Not Attribution: Localizing Decoder Bypass in Graph-Based Neural Marketing Mix Models" (arXiv 2606.12687); Bayesian Causal Marketing Mix Modeling research on hierarchical uncertainty-aware attribution; 2026 4,200-test A/B testing benchmark study (Visionary/DRIP Agency); 2026 eCommerce KPI Benchmark Report built from SEC 10-K data (Eightx); LTV:CAC Ratio Benchmarks 2026 (Foundry CRO).
Frequently Asked Questions
What is causal marketing mix modeling and why does it matter?
Causal marketing mix modeling forces a model to learn the actual structure of how channels interact before assigning revenue credit, instead of just optimizing for forecast accuracy. Standard neural MMMs can predict revenue well while still misattributing which channel caused it, because the model finds shortcuts that improve the forecast without reflecting real cause and effect.
How many sessions do I need to run a valid A/B test?
The median e-commerce A/B test needs roughly 14,800 sessions per variation to detect a 5% lift at 95% confidence and 80% power, based on a 2026 study spanning 4,200 tests. Brands with lower traffic should concentrate testing on their highest-traffic funnel steps and use qualitative research elsewhere.
Is the 3:1 LTV:CAC ratio right for e-commerce and DTC brands?
No. The 3:1 rule comes from SaaS, which runs 70 to 85% gross margins with recurring, compounding revenue. DTC ecommerce typically runs 40 to 60% gross margins on largely one-time purchases, so a healthy DTC LTV:CAC ratio sits closer to 1.5:1 to 3:1 depending on category and repeat purchase rate.
Why does blended CAC hide a bigger problem than it solves?
Paid CAC is running 2.4x to 3.1x higher than blended CAC across ecommerce in 2026. Reporting only the blended number flatters overall performance while hiding which specific channels are unprofitable on a per-customer basis, which leads boards to approve budget increases into channels that are losing money on every new customer.
More articles
View all →Geo Holdout Testing: A Step-by-Step Guide for E-Commerce Brands
Geo holdout tests answer the question attribution dashboards can't: does your ad spend cause revenue? This guide covers market selection, test design, runtime, and reading the results, with no data science team required.
The Platforms Grading Their Own Homework: Why Your Attribution Data Is Structurally Broken
A peer-reviewed paper from NeurIPS 2025 formally proves what performance marketers have suspected for years: the mechanism that decides which of your ad platforms gets credit for your conversions is mathematically designed to be gamed.
Incrementality Testing 101: What Every E-Commerce CMO Needs to Know
Incrementality is the question every marketing team should be asking: would these customers have converted without our ads? Here's how to find out, without a data science team.
Ready to prove your marketing ROI?
Book a free 30-minute consultation. Bring your ad account numbers; leave knowing which channels earn their budget.
Free. No commitment.